.png?width=300&height=58&name=Demo%20Account%20Logos%20(560%20x%20102%20px).png)
Platform: Web Application Only
User Type: Admin+Billing / Org Admin (for billing reports) / Admin and above (for general reports)
Difficulty: Intermediate
Estimated Time: 15 minutes
Last Updated: September 2025
Quick Summary
Master Dayworkbook's powerful reporting module to gain unparalleled insight into your organisation's daywork activities. Generate comprehensive reports with flexible filtering, visual analytics, and professional PDF exports to drive informed business decisions and enhanced productivity analysis.
What You'll Learn
- Navigate and utilise Dayworkbook's comprehensive reporting module
- Create targeted reports using advanced filtering capabilities
- Generate visual analytics with charts, graphs, and data summaries
- Export professional PDF reports for business presentations and analysis
- Configure report filters for precise business intelligence
- Optimise reporting workflows for enhanced decision-making
Before You Start
Prerequisites:
- Admin+Billing or Org Admin permissions for billing-related reports
- Admin or higher permissions for general reporting and data analysis
- Web application access (reporting module not available on mobile)
- Understanding of your organisation's reporting and analysis requirements
You'll Need:
- Clear understanding of what data insights you need for your business
- Access to completed and approved daywork sheets for meaningful reports
- Knowledge of your business reporting requirements and analysis goals
- Understanding of the data you want to analyse and present
⚠️ Watch Out: The reporting module is only available via the web application
Understanding the Reporting Module
Core Reporting Capabilities
Dayworkbook's reporting module provides comprehensive business intelligence tools:
Powerful Analytics Features:
- Comprehensive Coverage: Complete insight into organisation daywork activities
- Flexible Filtering: Multiple search criteria for targeted analysis and precise reporting
- Professional Output: PDF export capability for business presentations and documentation
- Visual Elements: Charts, graphs, and data summaries for easy interpretation
- Time Series Analysis: Trends and patterns over selected date ranges
- Resource Analysis: Detailed utilisation patterns for labour, equipment, and materials
Report Categories Available:
- Project Performance: Job-based analysis of time, resources, productivity, and efficiency
- Resource Utilisation: Labour, equipment, and material usage patterns and optimisation opportunities
- Client Analysis: Client-specific work patterns, project histories, and performance metrics
- Team Productivity: User-based performance analysis and activity tracking
- Operational Insights: Comprehensive business intelligence for strategic decision-making
🎯 Key Point: The reporting module transforms raw daywork data into actionable business intelligence
Visual Analytics and Insights
The reporting module provides rich visual elements for enhanced understanding:
Chart and Graph Types:
- Executive Summary: High-level insights and key performance metrics
- Trend Analysis: Time-based patterns showing performance over periods
- Distribution Charts: Resource allocation and usage patterns
- Performance Metrics: Key indicators for productivity and efficiency analysis
- Comparative Analysis: Period-over-period and project-to-project comparisons
Data Presentation Features:
- Professional Formatting: Business-ready presentation suitable for stakeholders
- Visual Hierarchy: Clear organisation of information for easy comprehension
- Interactive Elements: Detailed breakdowns and drill-down capabilities
- Summary Statistics: Key metrics and totals prominently displayed
- Context Indicators: Benchmarks and performance indicators for informed analysis
Step-by-Step Instructions
Step 1: Access the Reporting Module
Navigate to Dayworkbook's comprehensive reporting system:
- Web Application Access: Go to Reports section from the main navigation
- Module Overview: Review available report types and filtering options
- Permission Verification: Ensure you have appropriate access for the reports you need
Reporting Module Interface:
- Dashboard Overview: Summary of available reports and recent activity
- Filter Configuration: Comprehensive options for targeted analysis
- Report Library: Access to generated reports and saved configurations
- Export Options: PDF generation and download capabilities
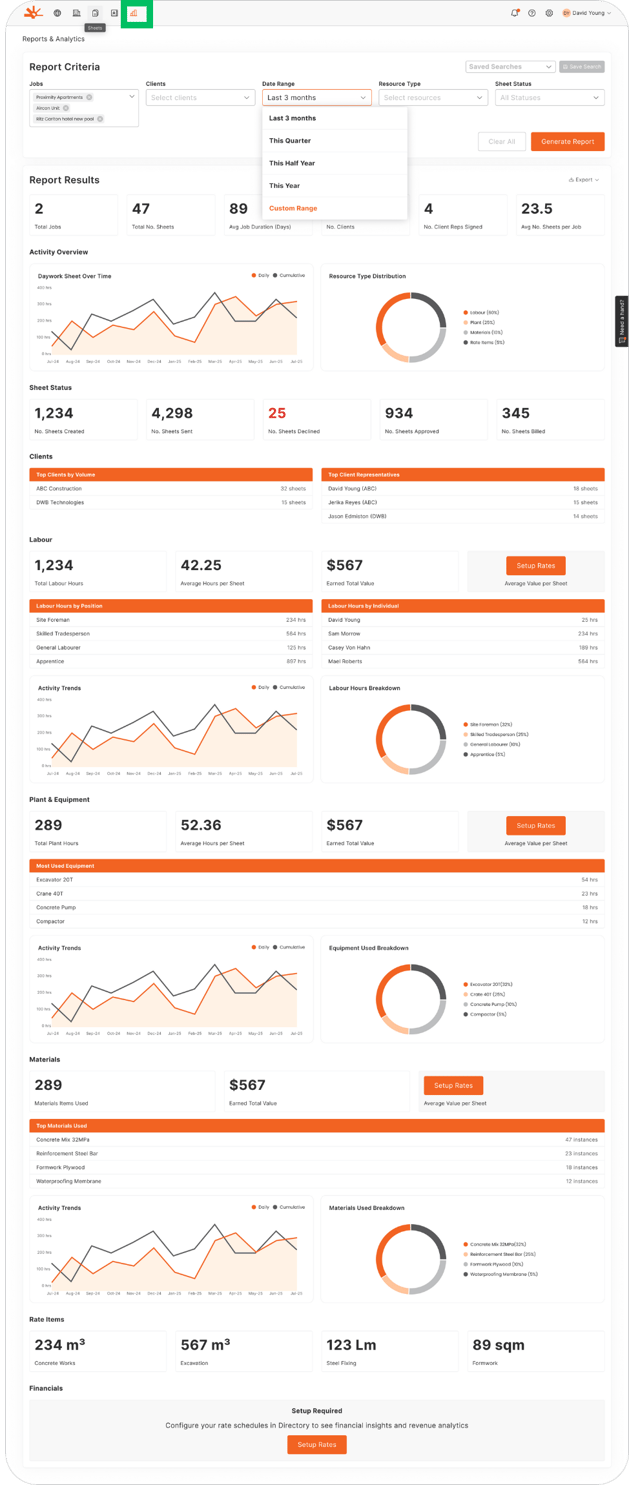
Step 2: Configure Advanced Report Filters
Create precisely targeted reports using comprehensive filtering options:
Primary Filter Categories:
- Date Range: Specify start and end dates for analysis period
- Project Selection: Filter by specific jobs, clients, or project categories
- User Activity: Focus on specific team members, departments, or roles
- Resource Types: Analyse labour, equipment, materials, or rate items specifically
- Client Focus: Generate client-specific reports for targeted analysis
- Status Filtering: Include approved, pending, or all daywork sheets in analysis
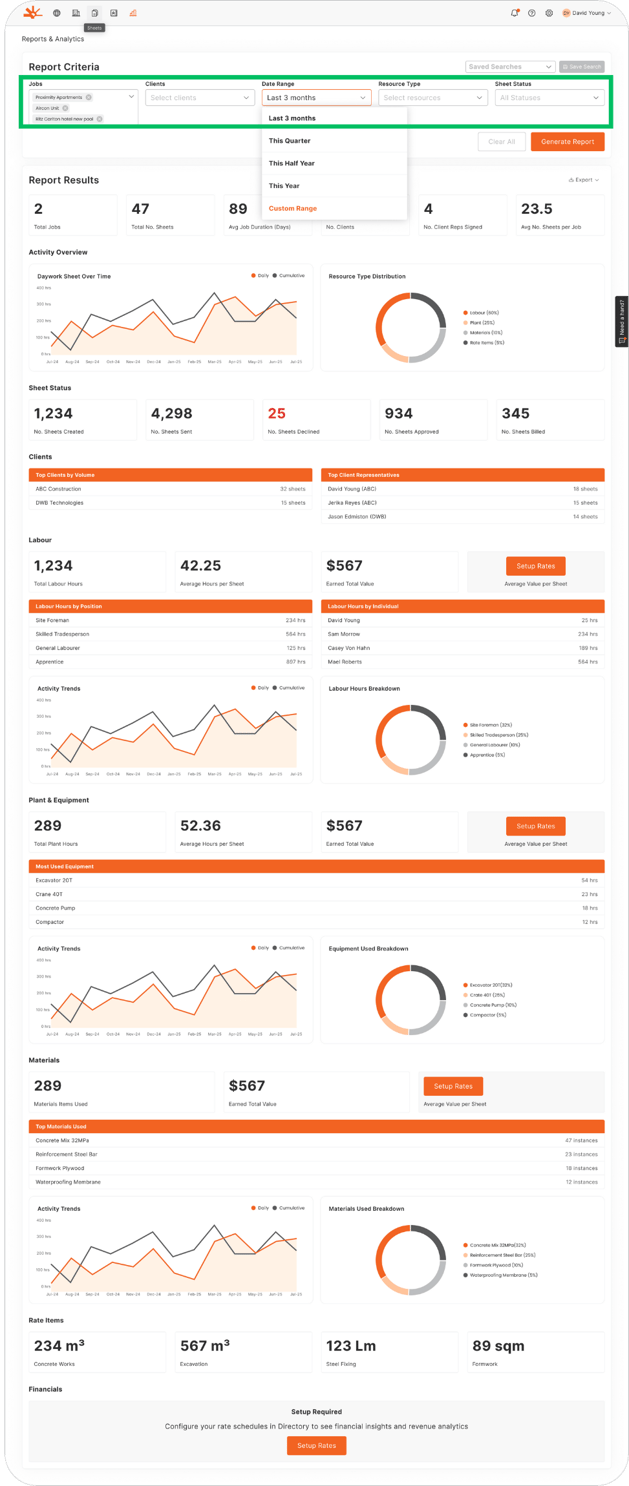
Advanced Filtering Process:
- Primary Criteria Selection: Choose your main analysis focus and objectives
- Date Range Configuration: Set appropriate time periods for meaningful analysis
- Secondary Filters: Apply additional criteria for refined and targeted results
- Filter Combination: Combine multiple criteria for complex analysis requirements
- Preview Results: Review filter impact before generating final comprehensive report
- Save Configurations: Store frequently used filter combinations for workflow efficiency
💡 Pro Tip: Layer multiple filters to create highly specific reports that answer precise business questions
Step 3: Generate Comprehensive Reports
Create professional reports with rich analytics and visual insights:
Report Generation Workflow:
- Filter Application: Configure your desired analysis criteria and parameters
- Data Processing: System processes data according to selected filters and requirements
- Visual Generation: Charts, graphs, and analytics are automatically created
- Report Assembly: Comprehensive report with summaries, details, and visual elements
- Quality Review: Examine results for completeness and accuracy
- Export Preparation: Finalise report for PDF generation and distribution
Comprehensive Report Content:
- Executive Dashboard: High-level insights, key metrics, and performance indicators
- Visual Analytics Suite: Multiple chart types showing trends, patterns, and distributions
- Detailed Data Tables: Comprehensive breakdowns with specific metrics and calculations
- Time Series Analysis: Performance trends over selected date ranges and periods
- Resource Utilisation: Detailed analysis of labour, equipment, and material usage patterns
- Performance Benchmarks: Key indicators and comparative analysis for strategic insights
Step 4: Export Professional PDF Reports
Generate and distribute professional business reports:
PDF Export Features:
- Professional Layout: Business-ready formatting suitable for executive presentations
- Visual Integrity: High-quality charts, graphs, and data visualisation
- Comprehensive Content: Complete data analysis with supporting details
- Brand Consistency: Professional presentation maintaining corporate standards
- Distribution Ready: Optimised for both digital sharing and physical printing
Export Process:
- Final Review: Verify report content and visual elements before export
- PDF Generation: High-quality document creation with professional formatting
- Download Options: Immediate download or save to report library
- Distribution: Easy sharing with stakeholders, teams, and decision-makers
- Archive Storage: Suitable for business records, compliance, and historical analysis
🎯 Key Point: PDF exports provide professional, shareable reports perfect for business presentations and strategic planning
Step 5: Analyse and Act on Report Insights
Transform reporting data into actionable business strategies:
Insight Analysis Process:
- Pattern Recognition: Identify trends, anomalies, and performance indicators
- Performance Evaluation: Compare actual results against benchmarks and expectations
- Opportunity Identification: Discover areas for improvement and optimisation
- Strategic Planning: Use insights to inform business decisions and resource allocation
- Action Planning: Develop specific strategies based on report findings
- Follow-up Reporting: Schedule regular reports to track progress and improvements
Business Intelligence Applications:
- Resource Optimisation: Identify underutilised assets and efficiency opportunities
- Performance Management: Track team productivity and project profitability
- Client Relationship Management: Understand client patterns and service delivery
- Strategic Planning: Inform long-term business strategy with data-driven insights
- Operational Excellence: Continuously improve processes based on analytical findings
Troubleshooting Common Issues
Problem: Cannot access reporting module or generate reports
Cause: Insufficient user permissions or mobile app usage
Solution: Verify you have Admin+Billing or Org Admin permissions for billing reports. Switch to web application as reporting module is not available on mobile. Contact Org Admin if you need additional permissions.
Problem: Reports showing incomplete or missing data
Cause: Date range filters too restrictive or missing daywork sheet approvals
Solution: Expand date range filters to include all relevant data. Verify that daywork sheets are approved before expecting them in reports. Check project selection filters for completeness.
Problem: Exported reports not displaying correctly or charts not loading
Cause: PDF viewer issues, browser compatibility, or processing errors
Solution: Try downloading the report again with stable internet connection. Update PDF viewer or try alternative application. Clear browser cache and retry if problems persist.
Problem: Report data doesn't match expected results
Cause: Filter settings excluding relevant data or incorrect report configuration
Solution: Review filter settings to ensure all relevant projects, dates, and users are included. Try generating broader reports first, then narrow down. Verify approved sheet status for missing data.
Problem: Charts and graphs not displaying properly in PDF
Cause: Browser compatibility or processing limitations
Solution: Ensure you're using a supported browser version. Try generating smaller date ranges if report is very large. Contact support if visual elements consistently fail to render.
Problem: Cannot find specific insights or data patterns
Cause: Insufficient filtering or wrong report type selected
Solution: Experiment with different filter combinations. Try broader date ranges and then drill down. Use multiple report configurations to understand different aspects of your data.
What's Next?
With mastery of the reporting module, your next steps are:
- Advanced Analytics - Develop deeper business intelligence capabilities using complex filter combinations
- Regular Reporting - Establish automated reporting schedules for consistent business insights
- Strategic Planning - Use report insights to inform long-term business strategy and resource allocation
- Performance Optimisation - Continuously improve operations based on analytical findings and trends
Related Articles
- User Access Management and Permissions - Configuring appropriate access for reporting functions
- Compiling Sheets for Billing - Creating professional billing reports for client communication
- Sheet Credit System and Auto Top-up - Understanding cost tracking for comprehensive reporting
- Client Communication and Billing Presentation - Professional presentation of analytical insights
Still Need Help?
If this article didn't solve your issue:
- Check "User Access Management and Permissions" for guidance on team member payment permissions
- Review "Compiling Sheets for Billing" for billing-specific report generation guidance
- Contact support via website or in-app chat
- Contact us via https://dayworkbook.com/contact/